References
Port facility in Rostock

Project Data
Client
Public port operator in Rostock
Project Period
2022, 2026
Project Scope
Surveying of approx. 1 km of quay walls
Scope of Services
Underwater survey of the seabed and quay structures
Photogrammetric above-water survey above the waterline
Terrestrial laser scanning
Creation of a digital twin in the InfraCloud
Deflection curve approximation and estimation of residual service life
Point cloud comparison: Alignment between the 2022 survey data and the current 2026 measurements
—————
Introduction
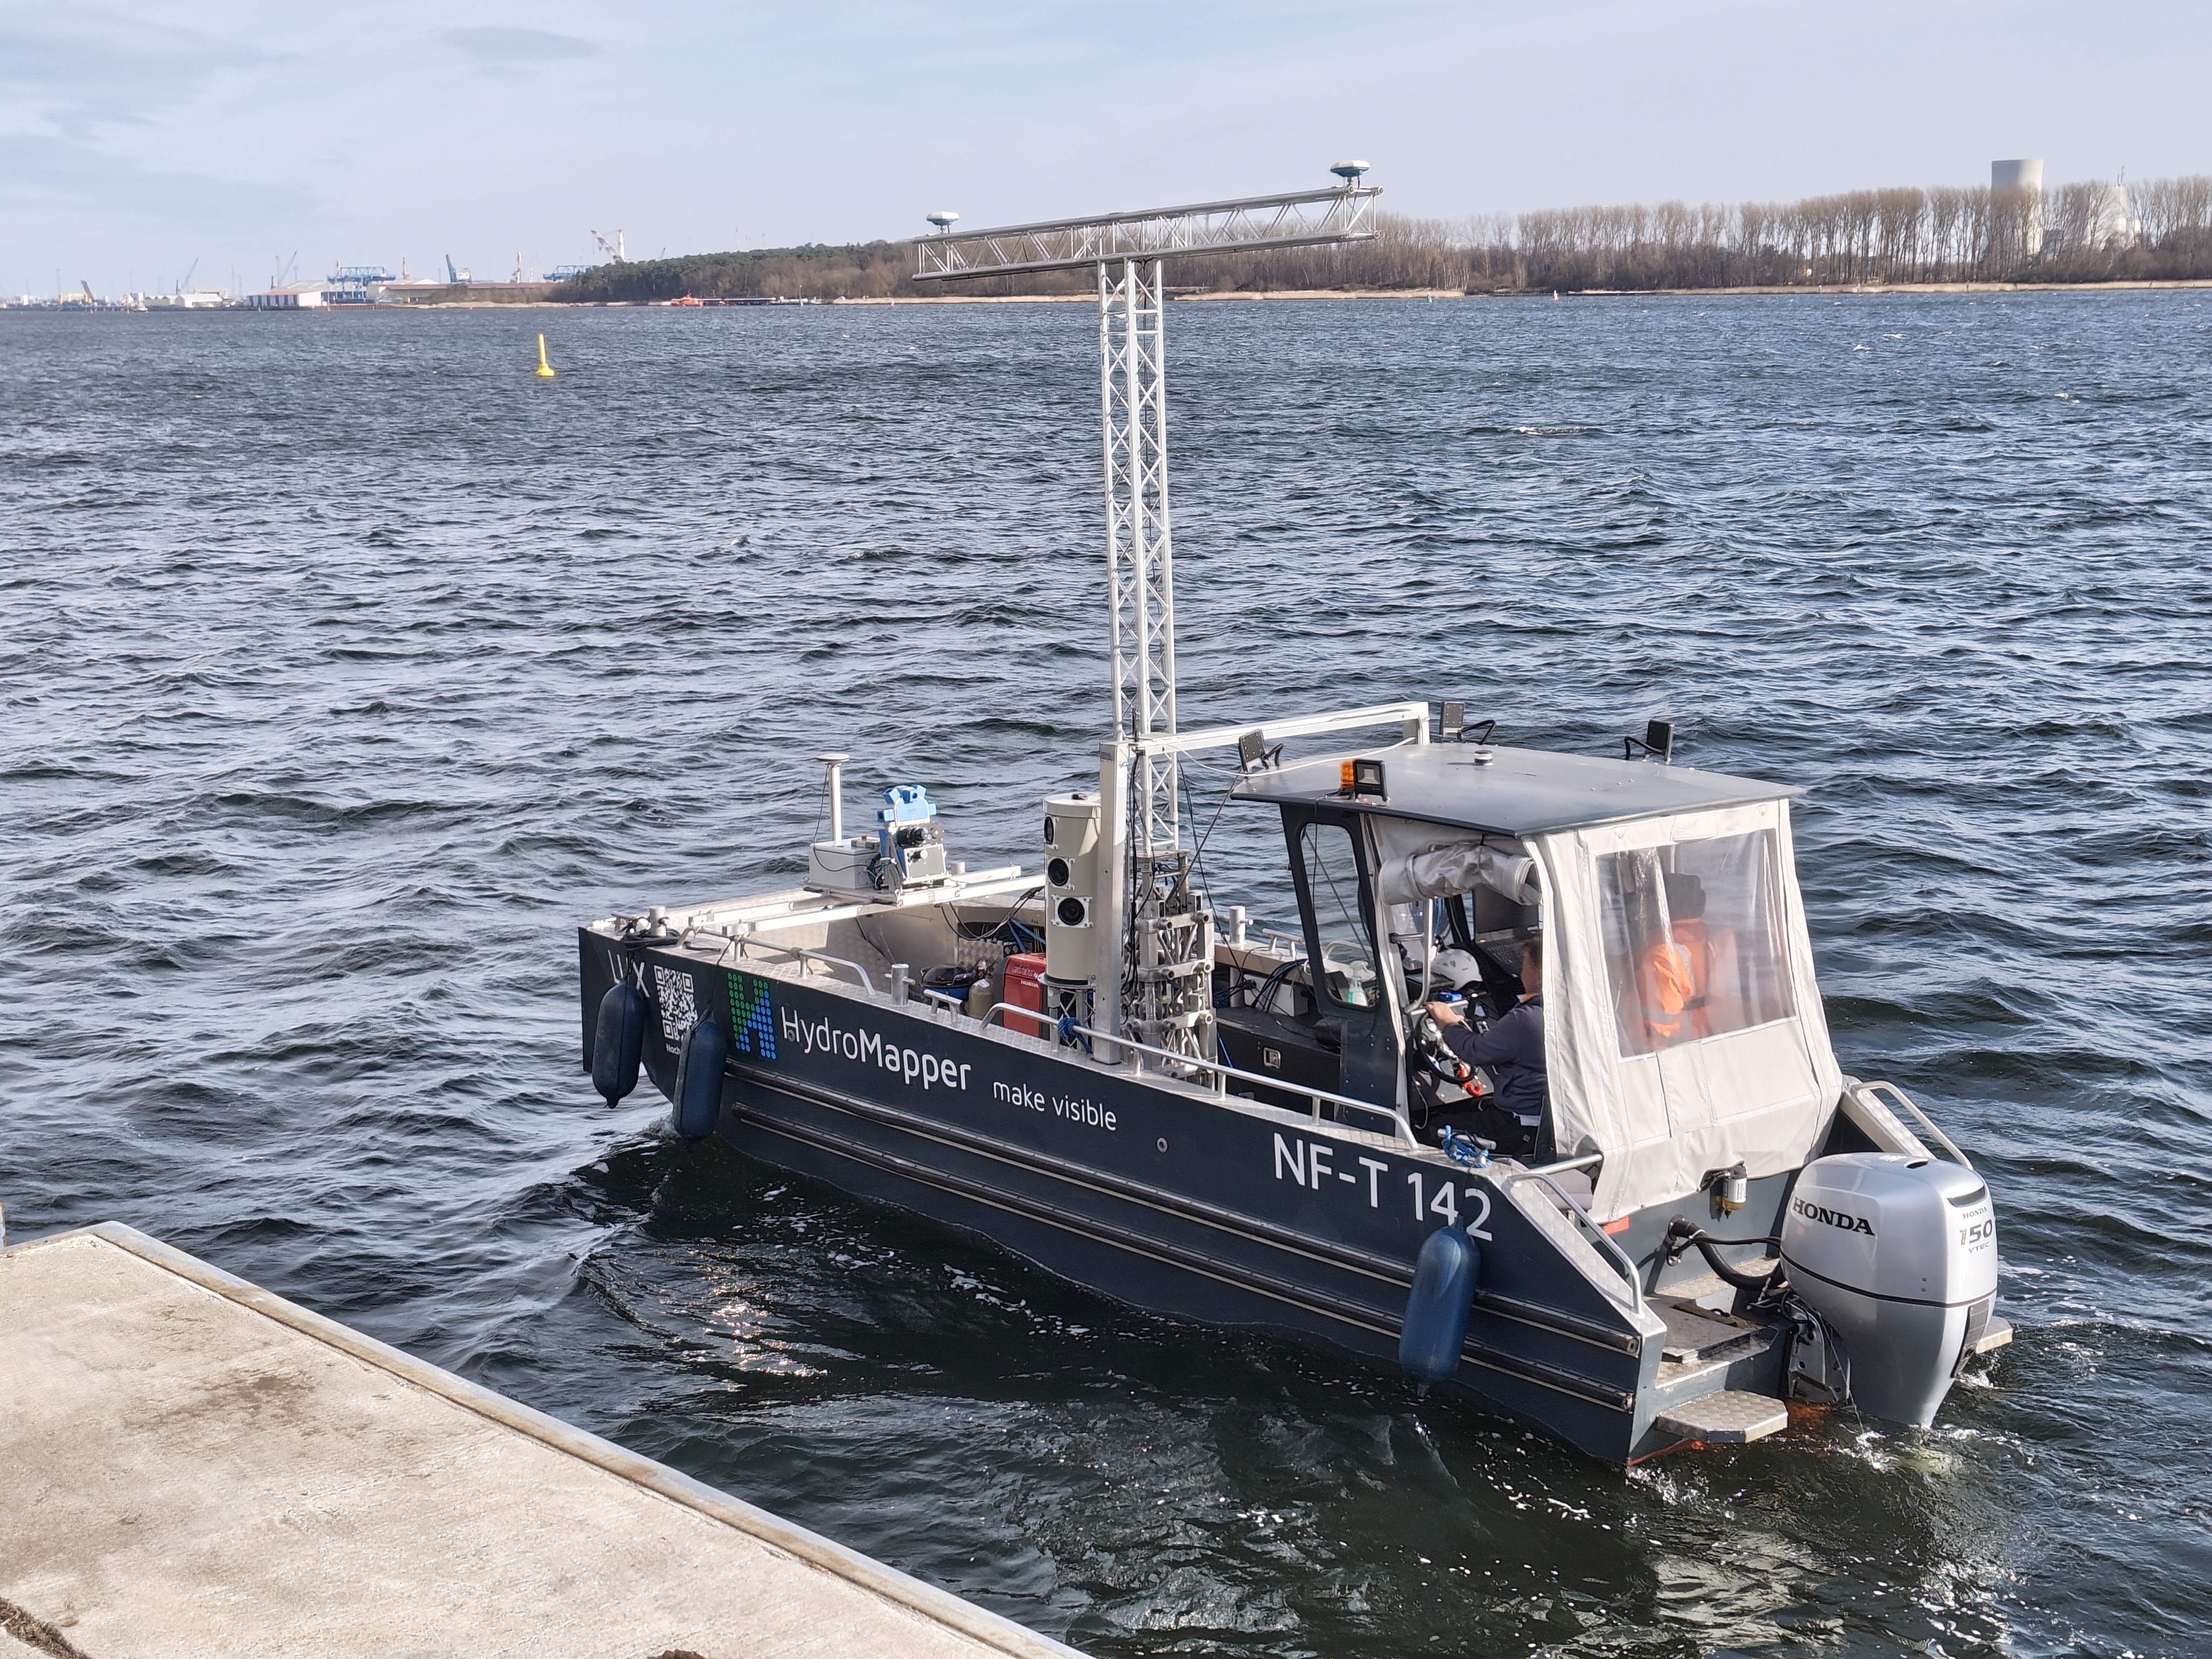
As part of a structural inspection for a public port operator in Northern Germany, the port infrastructure was comprehensively digitized to establish a robust foundation for assessing structural stability, condition, and residual service life. Utilizing state-of-the-art sensors such as HydroScan, HD mapping, and other surveying methods, HydroMapper captured the port structures completely above and below water.
The combination of diverse measuring methods resulted in a high-precision digital twin of the entire port infrastructure. The captured data enables more efficient inspections, well-founded condition assessments, and targeted planning for future measures and maintenance strategies.
Initial Situation
The objective was to perform a complete 3D survey of the port structures above and below the waterline. The goal was to establish a high-resolution database for structural inspections, condition analyses, and long-term monitoring processes.
Additionally, point cloud comparisons with future surveys were required to detect and evaluate structural changes at an early stage. To facilitate this, permanent targets were installed in selected structural areas to serve as reference points for recurring monitoring measurements.
Special challenges arose from the sheer scale and complexity of the port facilities, the differing structural generations, and the demanding conditions of ongoing port operations.
Our Approach
For the digital inventory capture, we deployed a combined surveying approach to map all relevant structural areas precisely and completely.
We utilized:
Hydrographic surveying via multibeam sonar
Underwater capturing with HydroScan technology
Photogrammetric surveying and terrestrial laser scanning above the waterline
Installation of permanent targets for monitoring purposes
By merging all datasets, we generated a unified digital model of the port infrastructure with high geometric accuracy.
From Physical Structure to Digital Twin
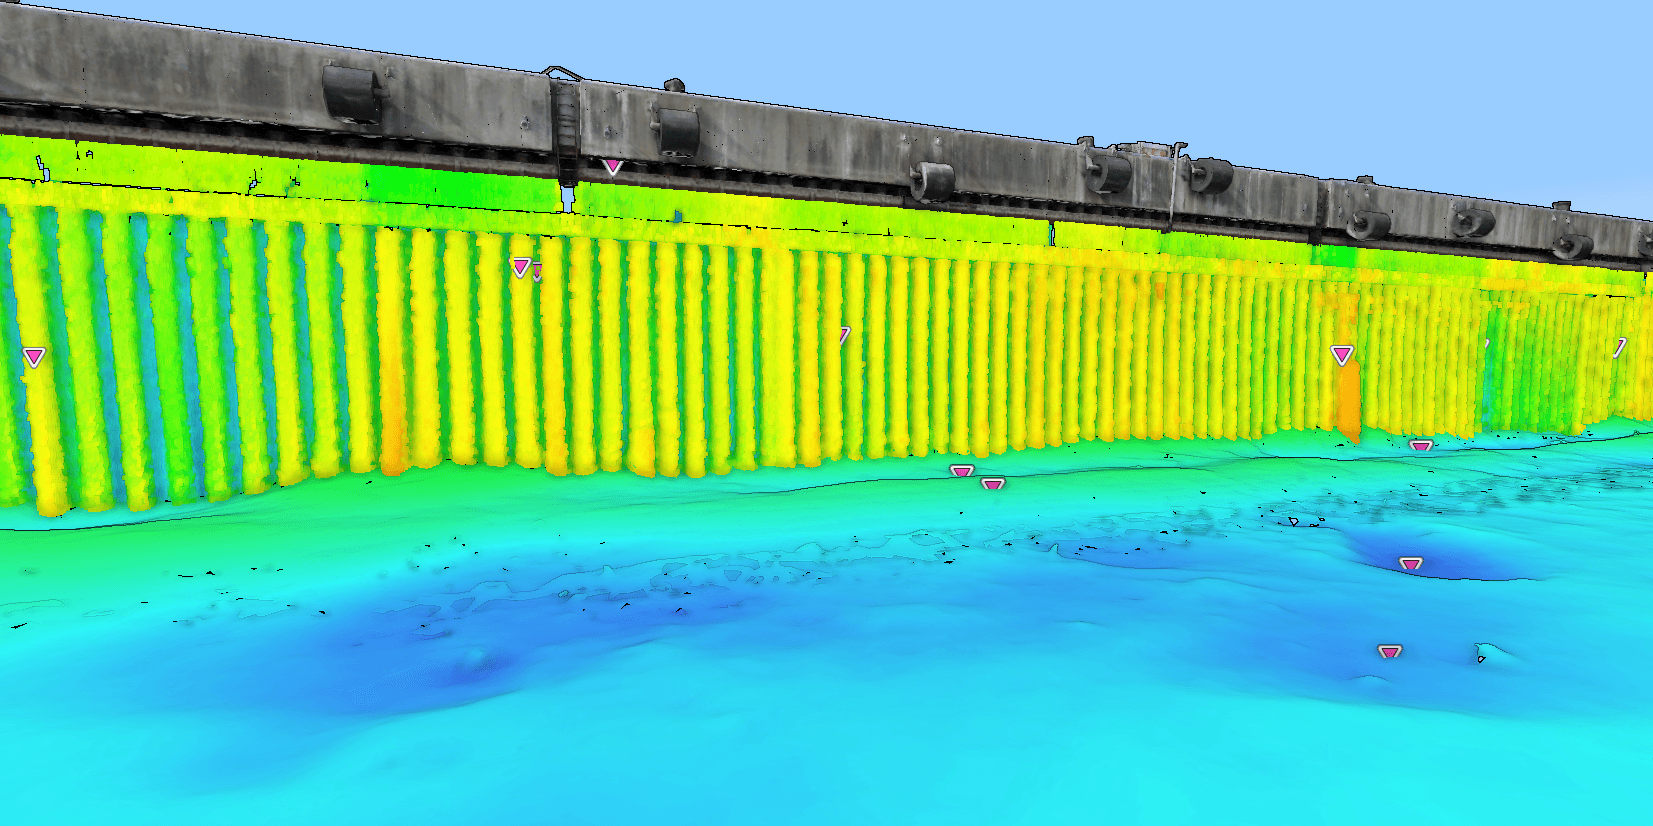
Underwater surveying using HydroScan, complemented by above-water capturing, enabled a comprehensive digital recording of the port structures. The acquired measurement data resulted in high-resolution point clouds, precise 3D models, and other digital datasets for detailed inventory documentation.
Combining underwater and above-water data provides a consistent, all-round view of the structures for the first time, allowing for precise analyses of structural changes and geometric deviations over time.

The Foundation for Sound Decision-Making
The generated digital database allows for a precise assessment of the current structural condition while simultaneously setting up the conditions for long-term monitoring and maintenance strategies. Thanks to the high resolution of the captured measuring data, even the smallest geometric changes in the structure can be traceably documented and analyzed.
The captured point clouds and 3D models form a reliable basis for upcoming structural inspections and future inventory surveys. At the same time, recurring monitoring measurements at defined intervals allow for a direct comparison with previous surveys. This makes it possible to detect structural changes early, track developments, and objectively evaluate potential damage patterns.
This yields a long-term data foundation for sound technical decision-making and for the targeted planning of future measures in the port area.

Outlook and Future Application
The generated data serves as the baseline for future structural inspections as well as long-term digital documentation of the port infrastructure. Furthermore, the defined monitoring points enable continuous observation of relevant structural areas over several years.
Looking ahead, the acquired data can be leveraged to translate the current as-built status into reliable planning data, enabling more efficient planning and execution of future repair and maintenance measures.


